NDIS Data Tool: Find Out Where Participants Need You
Most providers decide where to grow based on gut feel, word of mouth, or where their current clients happen to live. The NDIA publishes free data that can do much better. Its Explore Data tool shows where participants are, how many providers already serve them, how concentrated each local market is, and how much of participants' funding actually gets spent.
The NDIA refreshes the data every quarter (latest data: [DATA DATE]). So you can check whether an area is growing, crowded or underserved before you put money into expanding there.
What the tool shows
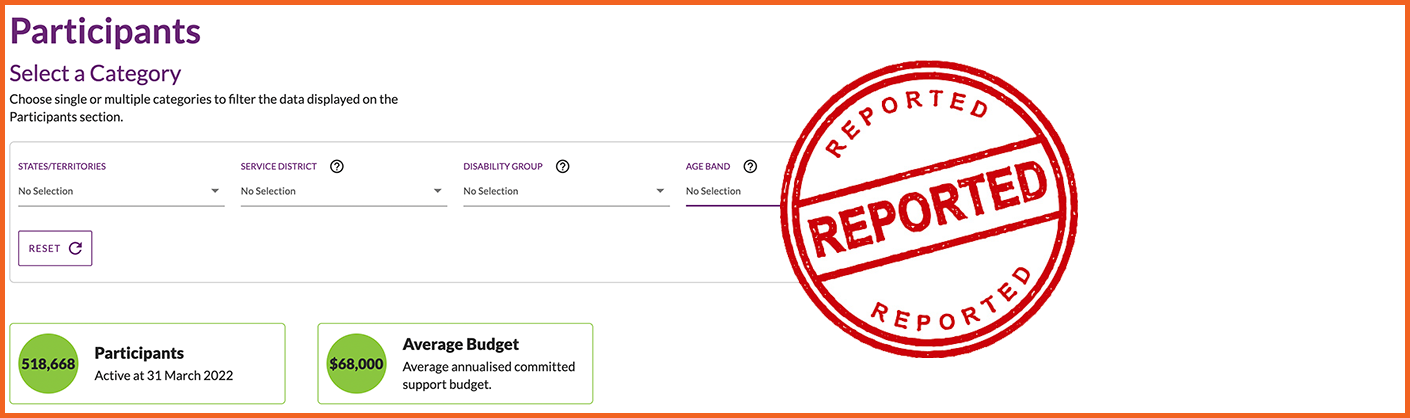
You can filter every data set by state or territory, disability group and age band. Some data sets also filter by support category (Core, Capacity Building, Capital). Then download the results to compare areas offline.
The four data sets that matter most for growth planning:
- Participants: how many active participants live in an area. This is your demand signal.
- Active providers: how many providers were paid for supports there. This is your competition signal.
- Market concentration: what share of payments goes to the 10 largest providers in the area.
- Use of plan budgets (utilisation): how much of participants' allocated funding was actually spent.
As you set filters, the tool also writes a plain-English sentence summarising what the numbers show. It's handy for a quick read before you dig in.
What the numbers mean
- Active participants are people with an approved NDIS plan.
- Active providers are providers that received NDIS payments for supports in the period. That includes registered and unregistered providers, as long as their supports were claimed through the Scheme.
- Market concentration is the percentage of total payments in an area that went to the top 10 providers by dollars received. High concentration means a few large providers dominate. For context, a December 2020 NDIA market report found the average across areas was 59%. Earlier NDIA reporting singled out areas above 85% for closer review. Treat those as reference points, not official cut-offs.
- Use of plan budgets compares what was spent with what was allocated. Low utilisation can mean participants can't find the supports they're funded for. But it can also reflect new plans, how a plan is managed, or personal choice. Read it alongside the other numbers rather than on its own.
How to spot an opportunity
No single number tells the whole story. Look at them together:
| What you see | What it may mean |
|---|---|
| Many participants, few providers | Unmet demand: participants may be waiting or travelling for support |
| Low use of plan budgets | Funding going unspent, often linked to thin supply |
| High market concentration | A few big players dominate, leaving room for smaller or specialist providers |
| Many providers, low concentration | A competitive market where you'll need to stand out on quality, speed or specialty |
The strongest opportunities usually show several signals at once. For example, a growing participant count, a flat or falling provider count, and below-average utilisation.
Example: an OT weighing up a new area
An occupational therapist who works with autistic children is thinking about expanding into a neighbouring area. In the tool, they:
- Filter by autism and the 7 to 14 age band.
- Compare participants per active provider in their current area and the neighbouring one.
- Check use of plan budgets for the same group in both areas.
- Check market concentration for Capacity Building supports.
Suppose the neighbouring area has more children per provider, lower utilisation, and a few providers taking most of the payments. That's a strong sign families there are struggling to find therapy, and a good case for expanding.
How to use the tool, step by step
- Go to Explore Data and choose a data set (start with Participants).
- Filter by state, disability group and age band to match your services.
- Repeat for Active providers, Market concentration and Use of plan budgets with the same filters.
- Download the results and line the areas up side by side.
- Come back each quarter to track whether the gaps you've spotted are growing or closing.
Make sure participants can find you
Data tells you where participants need you. Next, make sure those participants can actually find you. List your services on MyCareSpace so participants and their families in your target areas can discover and contact you.