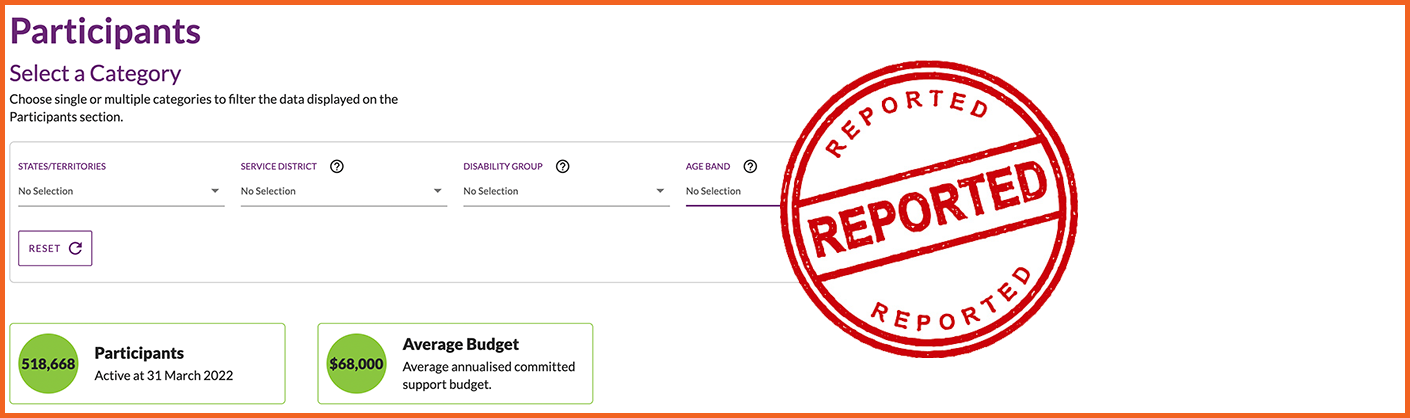
The NDIS Data Tool is one of the most useful free resources an NDIS provider can have, and most providers don't use it. The NDIA updates it every quarter, and it shows you where participant demand is, how much competition there is, and where funded supports aren't being delivered.
What the tool shows you
You can filter all of the data by state, service district, disability group and age band, then export it to Excel.
Participants: how many active participants are in an area. This is your demand.
Active providers: how many providers are delivering services there. This is your competition.
Market concentration: how much of the market is held by the biggest providers.
Plan utilisation: how much of participants' plan budgets is actually being spent.
What the numbers mean
Participants are people with an approved NDIS plan. Filter by disability and age to see the people your services are actually for, not just the total.
Active providers are providers who have been paid for delivering supports. Registered and unregistered providers are both counted.
Market concentration is the share of all NDIS payments in an area that goes to the 10 biggest providers. A high figure means a few large providers dominate. A low figure means payments are spread across many providers and the market is more competitive. The NDIA flags districts where more than 70% of payments go to the top 10.
Plan utilisation compares what has been spent against what participants have been funded for. Low utilisation can mean participants can't find the supports they're funded to receive.
How to spot an opportunity
No single number tells the whole story. Read them together:
- Many participants, few providers: demand may be outstripping supply.
- Low plan utilisation: funding is going unspent, often a sign there aren't enough providers.
- High market concentration: a few big players hold the market, so there may be room for a smaller or specialist provider.
- Lots of providers, low concentration: a competitive market. You'll need to stand out through a specialty, an age group or availability.
Treat low utilisation as a signal rather than proof, because participants can underspend for other reasons too.
Example
Say you're an occupational therapist who works with children with autism, and you're thinking about expanding into a neighbouring district. Filter the tool by that district, disability (autism) and age group (for example 7–14). Then compare it with the district you work in now. If it has more participants per provider and lower plan utilisation, you've found a market where families are likely struggling to find support.
How to use it
- Open the NDIS Data Tool and choose a data category.
- Filter by state and service district.
- Narrow it down by disability group and age band to match the services you offer.
- Export to Excel to compare districts side by side, or to track changes quarter to quarter.
Found a gap? Make sure participants can find you.
Knowing where the demand is only helps if participants in that area can find you. List your services and service areas on MyCareSpace, and we'll help connect you with participants and families looking for support near them.